ggplot2 Refresher Tutorial
ggplot2 Refresher Tutorial
Updated: 05/10/21
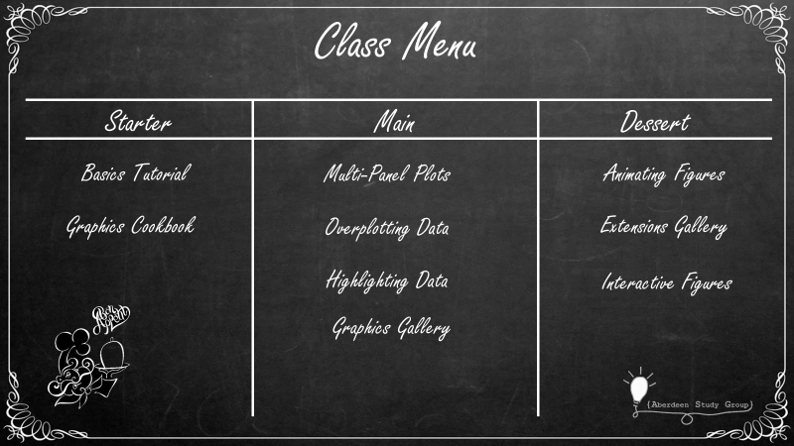
Welcome to the class! The workshop format means you can choose your tutorial based on your comfort level with using ggplot2. For this reason I have divided the class into a menu of resources associated with starters (beginners), mains (middle level) & desserts (extended level). A summary list is provided in the image below and the sections underneath will take you to the links belonging to each topic level (in addition to information on how to find relevent datasets and extra information on colour schemes etc).
Figure 1, Overview of tutorial options for the workshop.

Access Datasets
To access ready-made datasets to create graphical experiments, follow the link below.
https://vincentarelbundock.github.io/Rdatasets/datasets.html
Each of these available datasets are built into a package, also listed on the left side of the page. For example, if I wanted to use the “acme” dataset (the first listed on the page) I would check that the package “boot” is installed, load it by using the library() function and assign it a name to save it to my environment.
#install package
install.packages("boot")

#load the package
library(boot)

#save to environment
acme <- acme

#view the dataset
View(acme)

#Find out the structure of 'acme'. That is, are my variables numeric, categorical etc.
str(acme)
Starters
These resources are more appropriate for newcomers to using ggplot2 or individuals who want to learn some about some of the most popular geoms (types of graph!). Start with the tutorial on ggplot2 to learn the basic principles of building a ggplot (scatter) from scratch. Then, move on to the R Graphics Cookbook to learn about other geoms.
| Resource | Link |
|---|---|
| Basic Tutorial | https://rpubs.com/alexandra_jebb/ggplot2_thebasics |
| The R Graphics Cookbook | https://r-graphics.org/ |
Mains
If you already know how to build some of the basic geoms (types of graph!) and change the themes, you might want to try some of the resources in this section.
| Resource | Link |
|---|---|
| Combining figures into panel plots | https://rpubs.com/alexandra_jebb/CB_Multi_Panel_Plots |
| Varying tutorials with ggplot2 | https://www.r-graph-gallery.com/ggplot2-package.html |
| Learn to highlight data | https://cran.r-project.org/web/packages/gghighlight/vignettes/gghighlight.html |
| Handle overplotting of data points | https://ggplot2.tidyverse.org/reference/geom_jitter.html |
Desserts
| Resource | Link |
|---|---|
| Animating your plots | https://gganimate.com/articles/gganimate.html OR https://gganimate.com/ |
| Explore ggplot2 extension packages | https://exts.ggplot2.tidyverse.org/gallery/ |
| Make an interactive ggplot | https://www.r-graph-gallery.com/bubble_chart_interactive_ggplotly.html |
| Creating your own colour palettes | https://drsimonj.svbtle.com/creating-corporate-colour-palettes-for-ggplot2 |
| Adding a background image | https://github.com/AberdeenStudyGroup/studyGroup/blob/gh-pages/lessons/SG-T15%20ggplot2%20extension/ggplot%20background%20image.Rmd |
Everyone
Here is a list of resources that everyone can use to pick colour schemes, change theme aspects and find a quick list of the arguments available to manipulate ggplots.
| Resource | Link |
|---|---|
| ggplot cheatsheet | https://www.rstudio.com/resources/cheatsheets/ |
| Colours for base R | http://www.stat.columbia.edu/~tzheng/files/Rcolor.pdf |
| Colour-blind friendly palettes | https://cran.r-project.org/web/packages/viridis/vignettes/intro-to-viridis.html |
| Colour palettes with RColorBrewer | https://www.datanovia.com/en/blog/the-a-z-of-rcolorbrewer-palette/ |
| Pre-existing themes for ggplot2 | https://ggplot2.tidyverse.org/reference/ggtheme.html |
| Overview of basic arguments: ggplot2 | https://ggplot2.tidyverse.org/reference/ |
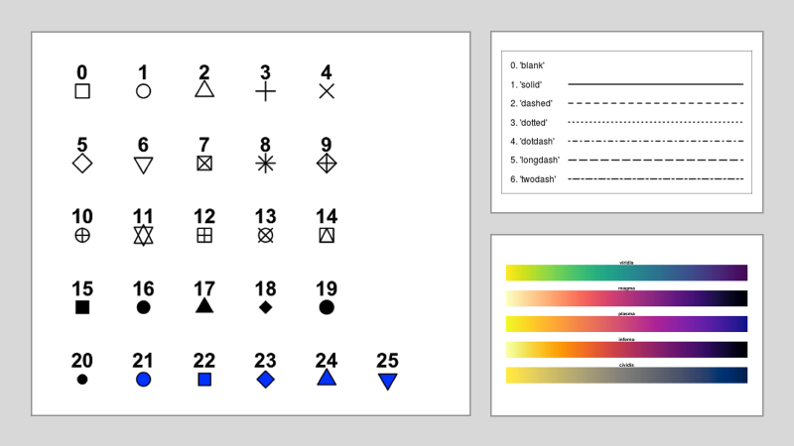
Figure 2, Guide to linetypes and point shapes available for ggplot2 as well as the colour blind friendly pallettes available in the package viridis.
